How to use Performance monitor in the Game Booster app
The “Performance monitor” is a feature located in the Game Booster app that monitors the temperature and memory status of the device during a game to improve the user experience.

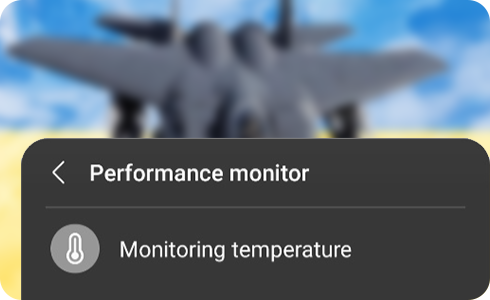
You can enter the Performance monitor screen by clicking a specific area of the Game Booster app main screen. Then choose “Monitoring temperature” or “Monitoring memory”.

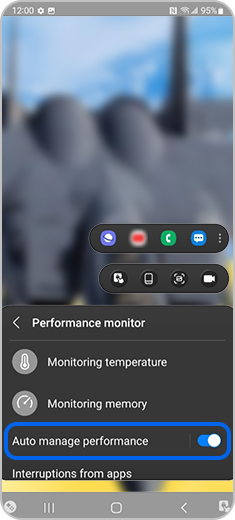
You can turn this feature On/Off by selecting “Auto manage performance” on the “Performance monitor” screen. If the temperature of the device becomes too high, the audio volume and the frame speed of the screen are automatically adjusted.
If device memory runs out, it will close other applications running in the background.

You can determine which app began running automatically and affected your game performance while playing a game by following these steps:
It displays the temperature/memory status of the device with the colour of the icon:
If the “Auto manage performance” is turned on, it will notify you that temperature or memory management is now operating by showing an edge notification.
Thank you for your feedback!
Please answer all questions.


